

Measurements realities and metrology’s answers
0:00 / 0:00
By Ian Wilcox
Metrology’s key
Having written several pieces in this magazine on the business impact and management of metrology, including looking at the implications of Industry 4.0 on measurement, I want to use this article to look more at a fundamental aspect of metrology that occurs at the point of every measurement. If you get Metrology training, this should be front and centre and threaded throughout the course, every course I create carries this in some context or other.
In metrology terms, we call the thing to be measured, the Measurand. Metrology terms commonly used around the world are specified in the International Vocabulary of Metrology also known as the VIM, not IVM. As you use formal metrology related acronyms, get used to some acronyms not quite matching the English name. The reason is because very often, these names originate from the French, in this case, Vocabulaire International de Métrologie (VIM).
What is a measurement?
When we take a measurement, the final recorded output is often a single value. I have said before, this single number fools us into thinking measurement is a quantitative process always outputting a single value. But in practice the laws of physics in the form of process variations will influence that single value into a dynamically shifting number. Hence the real skill in metrology is sensibly estimating the inevitable variation range of that process. We get to recognise that any single measurement is only a frozen snapshot of a value within that range, which we call uncertainty. Those process variations and human influences, and likewise our ability through procedures to lessen the impact of any uncertainty variation, make measurement a profoundly qualitative outcome, heavily influenced by individual skills.
A simple example of variation would be that as metal gets warmer it expands, and conversely contracts as it cools. So, using a digital micrometer, you measure a machined aluminium block straight off the machine tool when at 30 degrees to be 300.020mm. Minutes later you measure it again and it has cooled to 25 degrees. You may find that it now measures 299.986 because it has shrunk just under 34 micrometres (0.034mm). By the time it reaches 20 degrees centigrade the length will have dropped by 69 micrometres (0.069mm).
20 degrees centigrade is the temperature set out in the standard ISO 1 as the international reference temperature that the national standard for the metre is measured at. That national standard sets the unit of the metre and all its derivatives, such as the mm. Any stated measurement length should also relate to a size at that temperature and is assumed to have either been controlled to it or converted to what it would be at 20 degrees centigrade.
Temperature is only one of many causes of variation. This and many other factors all combine to influence the measurement result, causing ever-changing dynamic effects on the result. Some are larger than others and each single cause of variation will have different relevance to your measurement dependant on the equipment, operator, parts, environment and processes. For example, we have already said aluminium expands at 0.024mm per degree per metre. If your part is a 3-metre-wide housing then that is 0.072mm per degree, but if you make 5mm diameter rivets, it means only 0.00012mm per degree. Keep your perspective on what matters.
So in summary, the key to unlocking measurement is to understand two things, how much variation may occur if you were to repeat your measurement many times, which is also known as ‘Precision’, and how wrong your answer could be from the true size of the measurand, also known as ‘Accuracy’. Note the two distinctly different metrology meanings compared to dictionary English which counts them as synonyms.
True Value
In the VIM we would find the term ‘true value’, it is deemed as the correct result of a perfect measurement, the measurement result that we hope to capture, no error and no variation. The undisputable number that we could bet our salary on as to what the correct size is that we have measured…… Not as simple as it sounds.
We cannot suspend all the things that create variation and therefore doubt. If I gave you a 20mm gauge block that is calibrated and stated to be 20.0002mm in size, then isn’t this the true value?
Not exactly, the calibration certificate will state that labs uncertainty, the calibration company through the calibration certificate will state ‘their estimated process variation’. Their stated uncertainty is a statistically calculated margin of potential error in the result they give you. This makes them compliant with the rules they must follow to trade as an ISO:17025 certified laboratory.

Looking at a calibration certificate, it will state their measured size, but they also add an uncertainty based on a statistically derived value. So, typically the calibrated gauge block may be stated at 20.0002mm +/- 0.00015 at 95%. This is a recognition that no measurement is ever definitive due to variation and accuracy error. What they are stating is that they have stated a
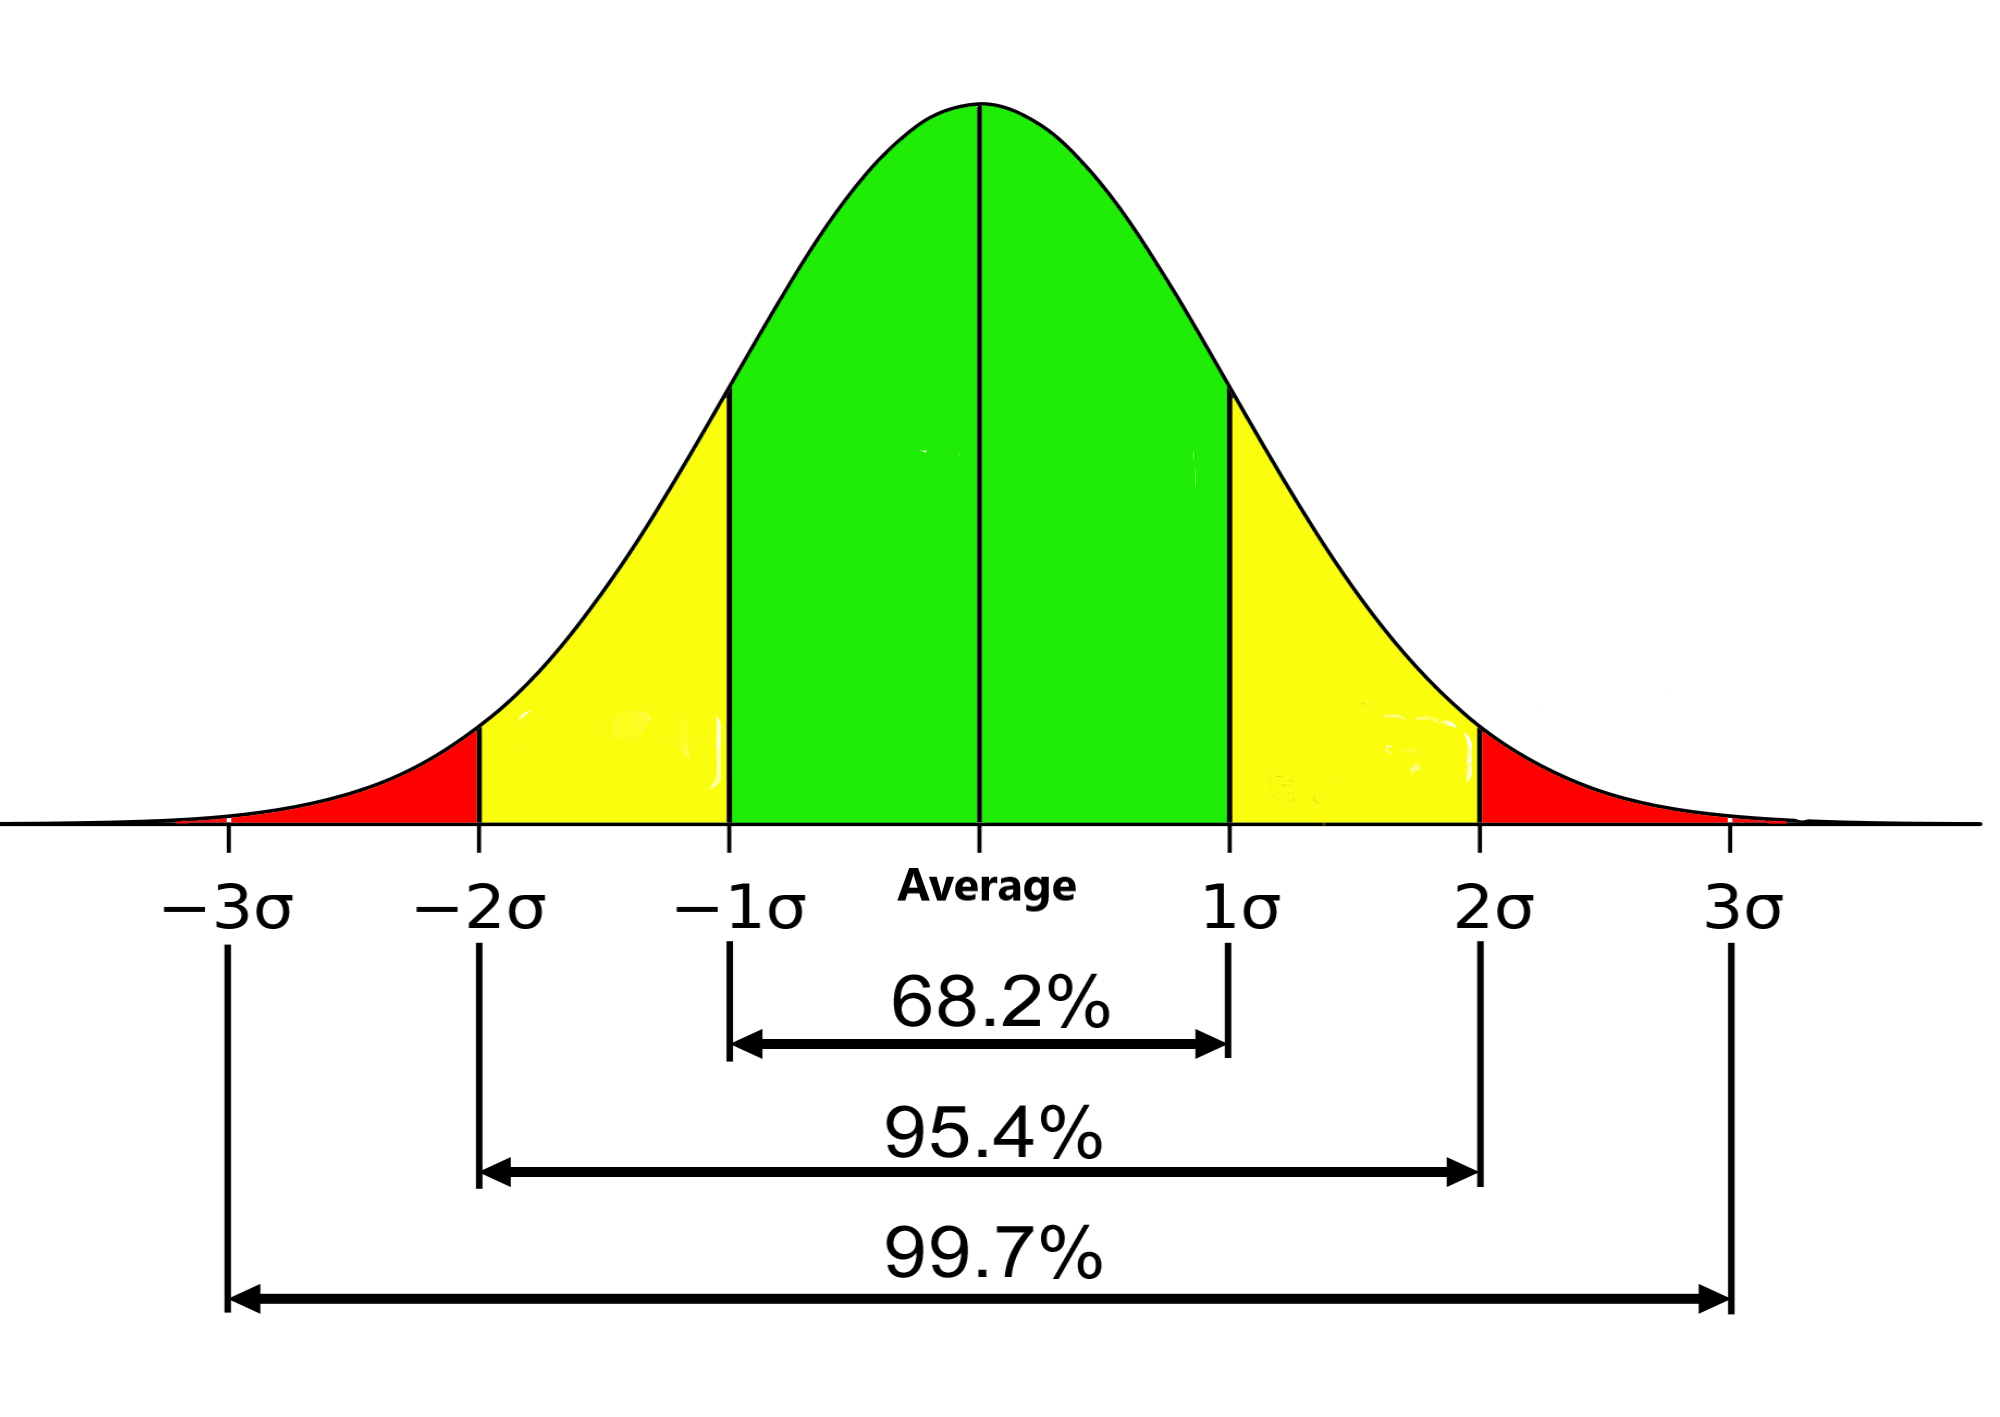
measurement result that falls somewhere between 20.00005mm to 20.00035mm with a 95% confidence, the 95% means that 95 times out of hundred (statistically estimated), if you were to repeat the measurement, the answer would fall into this range, sometimes this is stated as k2. The 5% left outside of that uncertainty statement still exists but is attributed as being beyond +/-2 standard deviation of a normal distribution curve and therefore has only a 5% probability of happening, the red zones on my image.
We know that the true value is the correct and perfect result. With a little thought we can deduce that we can never fully know the true value. It is impossible to ever know for certain as there will always be undetected variations and the number of decimal places can be infinite. If a measurement result is dynamic and we always have uncertainty in any measurement, there is of course no certainty of any single result. You can be fooled by measurement equipment with a low resolution that your result repeats, but it just means your variation is less than the equipment resolution can show, it still exists but your equipment just cannot report it. Measure that 20mm gauge block with a rule and it will always be 20mm, no decimal places, no detection of the variation. But it still exists.
Let us have a closer look at true value, accuracy and precision in a graphic. In metrology, we treat accuracy and precision separately. In the case of precision, it is the range of variation that can be at least partly captured by repeating the measurement, I say partly because to know all of the variation, we would need to take infinite measurements that reflected all the variables and their resultant infinite variations. Not an appealing option unless you have infinite time.
We can realistically only sample and therefore with pragmatism, estimate what the total variation may be. Any estimation of variation should be proportionate to the task. Measurement costs, so try not to over measure. In my example graphic, I have taken five measurements X1 to X5 and plotted them on the line. The range from the biggest to smallest (Range) is also what we call precision. Think of it as the clustering when you repeat the measurement. These are called random errors, variations that occur as we repeat our measurement process.
Back to the graphic, from these five values, we can work out our average. This is a better estimate of size than any single value but of course, we cannot measure everything multiple times in a production context. Better to control your precision to be proportionate to any tolerance or manufacturing process variation of the measurand, hence the 10% or less on a GR&R. Therefore, we look to periodic Gauge Capability studies to understand how much the measurement process contributes to our measurement uncertainty. Giving us confidence in any single measurement result or sampling plan that our uncertainty is within acceptable margins.
But you will note that this still may, or may not, be near the true value we were after. In my last article for MTDCNC, I gave an example of accuracy and precision, I noted that if you wrongly set the zero on a digital micrometer so that when reading 1mm it is actually at the zero. Any measurements you take are 1mm in error, a 10mm block would read 11mm. So, any variation would seem to be around 11mm because of this 1mm error in the setting. The offset error is what we call a systematic error.
Systematic errors are errors in calibration or setting that are a constant underlying bias (accuracy on my graphic) We can understand bias exists and try to control it through process and procedures, minimising this accuracy error to an acceptable level.

Causes of variation
Causes of variation are mainly rooted in physics and human behaviours as well as other causes. Variables are caused by different operators, different environmental conditions, failure of the procedure, variation in equipment etc. It is useful to break the causes of variation into the key elements of the actual process under scrutiny. This helps us build the possible causes in a structured way. For example, but certainly, not the only way of structuring this is shown here. We could look at sub-groups of causes such as the measurement equipment, the people and procedure involved in the process, the properties of the thing to be measured and any environmental influences. We can map these by using a Fishbone Diagram.
We have looked at temperature previously and its relation to the expansion co-efficient of materials. We could add this to one of the inputs under the environment. Along with particle contamination (dust, swarf etc.), humidity, vibration and even ambient light, if it can affect the result to any notable degree.
A key underpinning skill required by Metrologists and the measurement specialist/technician in your business is in understanding how those variations contribute to your own reality across all the potential causes. More on those skills in the next article.